

Wallet and spend cap
Two cards sit at the top:Wallet
Your current credit balance.
Spend cap
Your tenant budget — the ceiling on what the org can spend.
Choosing a window
A window selector scopes everything below it to 1h, 24h, 7d, or 30d.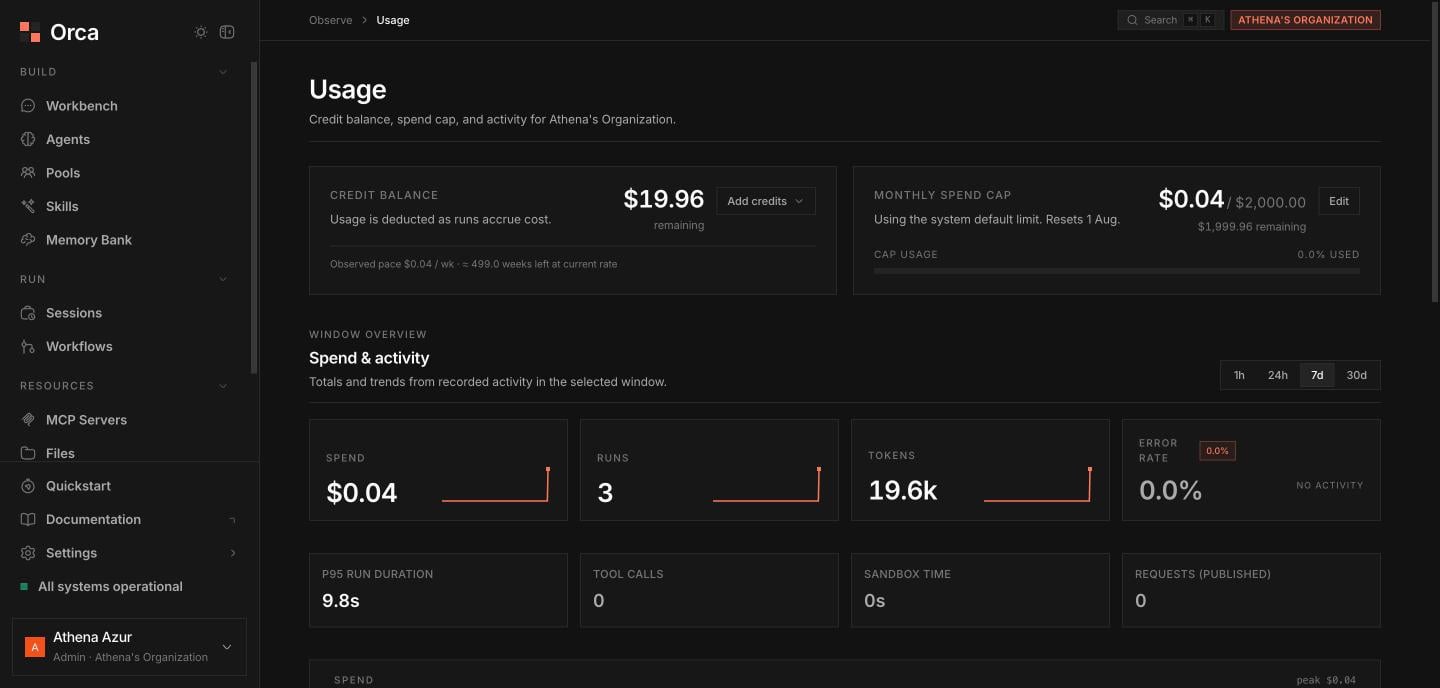
Usage — credit balance, monthly spend cap, and spend/activity KPIs.
KPI cards
Four headline metrics, each with a sparkline for the selected window:Secondary meters
Below the headline cards, additional meters cover P95 duration, tool calls, sandbox time, and requests (inbound requests to published agents).Trends and breakdowns
- A time-series chart plots activity across the window.
- The By-agent table breaks usage down per agent: tokens, runs, failed, input / output / cached tokens, tool calls, and sandbox time.
- The Top published agents list ranks published agents by inbound requests.
Related
Billing
Credits, metering, and spend caps.
Stats
Fleet-level operational metrics.