

Stats isn’t a primary sidebar item. Reach it from the command palette (⌘K / Ctrl+K) or from links elsewhere in the dashboard.
Agents
Fleet metrics for your agent profiles.- Window selector — scope the view to a time range.
- KPI strip — agents, live sessions, runs, and tokens.
- Throughput chart — activity over time, with a hover tooltip.
- Health status bars — session and run status distribution, plus runner-pool health.
- Hotspot lists — top token consumers and failing agents.
- Agents table — sortable and paginated, one row per agent.
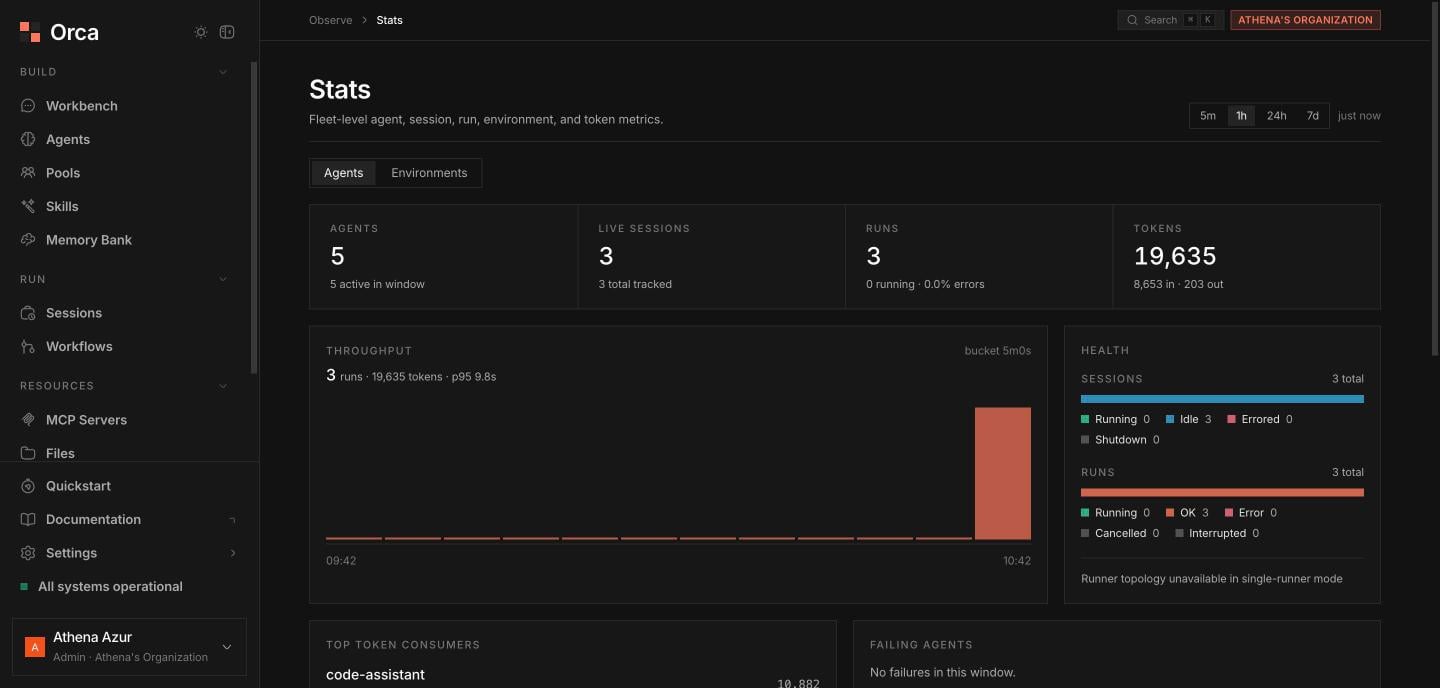
Stats — fleet-level agent, session, run, and token metrics.
Environments
Fleet metrics for sandbox compute leases (see Sandboxes and the Environments screen for per-lease detail).- Sandbox-lease KPIs.
- Environment-state bar — distribution across lease states.
- Sandbox audit timeline — a fleet-wide feed of
allocate/pause/resume/release/errorevents. - Live leases table — currently active leases.
Related
Usage
Credit balance and billing activity.
Environments
Per-lease sandbox detail and audit.