> ## Documentation Index
> Fetch the complete documentation index at: https://docs.orcapods.ai/llms.txt
> Use this file to discover all available pages before exploring further.
# Usage
> Credit balance, spend cap, and windowed activity for your organization.
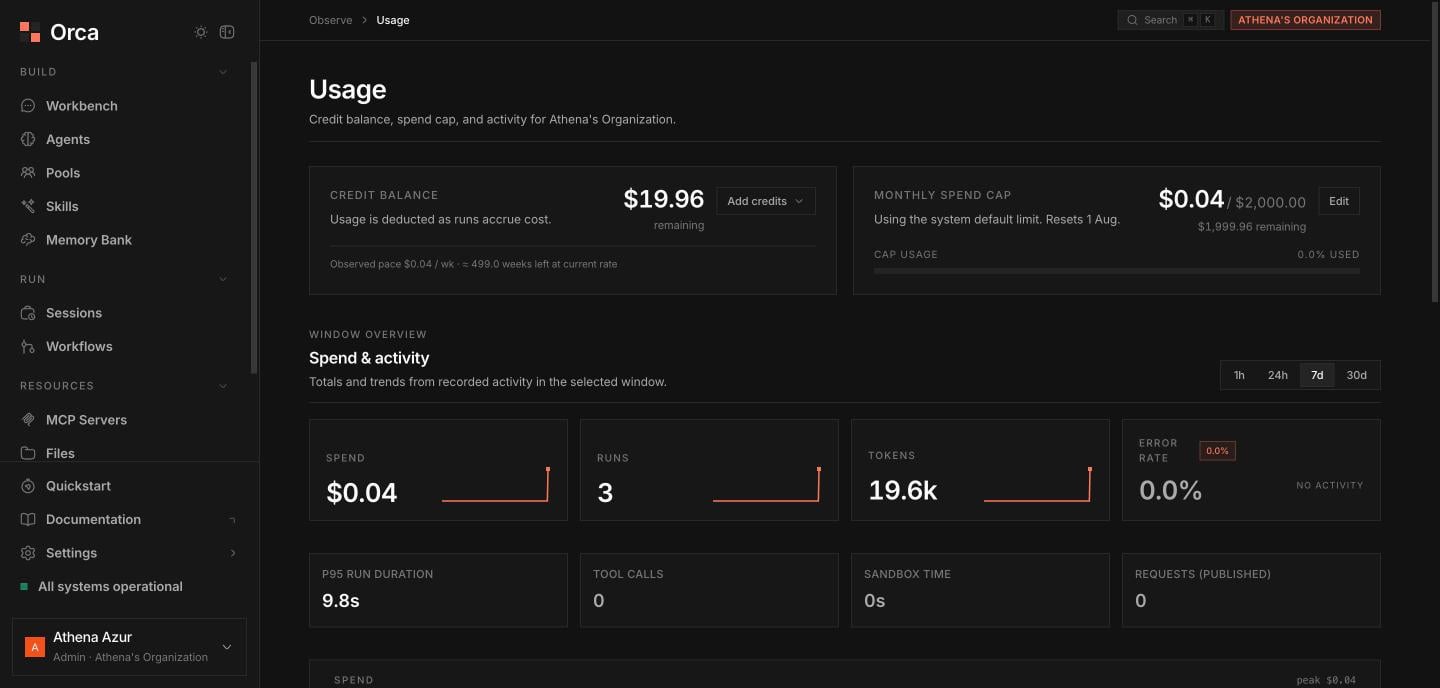
The **Usage** screen is your organization's billing and activity dashboard: what's in the wallet, what your budget cap is, and how spend, runs, and tokens are trending. For how credits and metering work, see [Billing](/concepts/billing).
## Wallet and spend cap
Two cards sit at the top:
Your current **credit balance**.
Your tenant **budget** — the ceiling on what the org can spend.
## Choosing a window
A **window selector** scopes everything below it to **1h**, **24h**, **7d**, or **30d**.
 ## KPI cards
Four headline metrics, each with a **sparkline** for the selected window:
| KPI | Shows |
| -------------- | -------------------------------------------------------- |
| **Spend** | Credits consumed. |
| **Runs** | Number of runs. |
| **Tokens** | Total tokens, with an input / output / cached breakdown. |
| **Error rate** | Share of runs that failed. |
### Secondary meters
Below the headline cards, additional meters cover **P95 duration**, **tool calls**, **sandbox time**, and **requests** (inbound requests to published agents).
## Trends and breakdowns
* A **time-series chart** plots activity across the window.
* The **By-agent** table breaks usage down per agent: **tokens**, **runs**, **failed**, **input / output / cached** tokens, **tool calls**, and **sandbox time**.
* The **Top published agents** list ranks published agents by **inbound requests**.
## Related
Credits, metering, and spend caps.
Fleet-level operational metrics.
## KPI cards
Four headline metrics, each with a **sparkline** for the selected window:
| KPI | Shows |
| -------------- | -------------------------------------------------------- |
| **Spend** | Credits consumed. |
| **Runs** | Number of runs. |
| **Tokens** | Total tokens, with an input / output / cached breakdown. |
| **Error rate** | Share of runs that failed. |
### Secondary meters
Below the headline cards, additional meters cover **P95 duration**, **tool calls**, **sandbox time**, and **requests** (inbound requests to published agents).
## Trends and breakdowns
* A **time-series chart** plots activity across the window.
* The **By-agent** table breaks usage down per agent: **tokens**, **runs**, **failed**, **input / output / cached** tokens, **tool calls**, and **sandbox time**.
* The **Top published agents** list ranks published agents by **inbound requests**.
## Related
Credits, metering, and spend caps.
Fleet-level operational metrics.